
In a previous article, I covered Window’s kernel driver KAPC injection and how it can be used to enable the collection of security-related telemetry. While KAPC injection, along with a myriad of methods (think DLL injection, mini-filters, etc.), are the “go-to answers” for Windows-based systems, that only covers one piece of our infrastructure puzzle. Therefore, the question must be asked, what is a Detection Engineer to do about our Linux-based counterparts?
While many EDR-like software tools take a similar approach in the Windows world, the answer isn’t nearly as clear-cut on Linux-based systems. EDR developers have several differing options on Linux, each with their own set of pros and cons. One could argue that continuously parsing and scraping the /proc directory is enough to obtain security-relevant data. Heck, with a decent query language paired to enable detection, this method may even be semi-effective for trivial detection tasks (at the cost of eating your system’s resources for lunch).
Loadable Kernel Modules (LKMs) were historically the “accepted” answer for gathering kernel-level security-relevant data. If you’re unfamiliar, LKMs are akin to Windows kernel drivers (read: both exist to extend the functionality of the base kernel). The issue, however, is that LKMs struggle with the same issue that Window’s kernel drivers suffer from. Developing LKMs is difficult, maintaining them is difficult, and ensuring they are secure is, you guessed it, difficult. What could have been a small bug in a user-mode program is now a thehackernews.com story waiting to happen in kernel-land. It’s a good thing that a EDR agent has never had a major, world-stopping, bug before though…
This difficulty of development and inherent danger has pushed linux EDR developers to a new player (“new” is used loosely here). Birthed from the Berkley Packet Filter (BPF) used to monitor and filter network packets, the Extended Berkley Packet Filter (eBPF) is a linux EDR developer’s dream-come-true. Side note: acronyms are a heavy topic in tech as it is, and eBPF is probably one of the worst offenders.
First off, this acronym doesn’t really make sense if you don’t understand the history, Berkley Packet Filter, or classic BPF, was the original project designed as a network tap. BPF Permits the capturing and filtering of network packets. If you’ve ever ran this code:
sudo tcpdump port 80you’ve used BPF.
eBPF is the natural evolution to the BPF project, a “hook-based” architecture for monitoring (and filtering) much more than just network packets. eBPF is an event-driven, efficient, and safe sandbox (virtual machine) for running user-supplied-and-compiled bytecode inside of the Linux kernel. If that sounds like a lot to describe in a single sentence, that’s because it is. If you’re at all familiar with the Windows way of thinking, eBPF is what NTDLL hooking wishes it could be and more.
Enough theory, let’s talk about how eBPF actually works. eBPF, as you can imagine, is decently complex at a low-level. Programming directly “in eBPF” is difficult considering the kernel expects eBPF workflows to be pre-compiled into bytecode (think, machine code for virtual machines). This initial complexity roadblock has made libraries such as bcc, libbpf, and others very attractive for developers looking to utilize eBPF.
The hook-based architecture is potentially one of the most interesting aspects of eBPF. Let’s take a quick look at the different types of hooks eBPF offers to developers.
- tracepoints:
- static hooks into kernel events defined in kernel source code. Highly stable, not dynamic.
- Ex://
tracepoint:sched:sched_process_exec
- Ex://
- static hooks into kernel events defined in kernel source code. Highly stable, not dynamic.
- raw tracepoints:
- lower-overhead, higher flexibilility implementations of tracepoints.
- Ex://
rawtracepoint:sched_process_exec
- Ex://
- This is confusing, what does this mean?
- raw tracepoints receive raw memory as a parameter and therefore skip some pre-processing done by the kernel.
- Developers must make sense of structures or passed parameters manually.
- lower-overhead, higher flexibilility implementations of tracepoints.
- kprobes:
- dynamic hooks into kernel-space functions.
- Ex://
kprobe:kernel_execve
- Ex://
- dynamic hooks into kernel-space functions.
- uprobes:
- dynamic hooks into user-space functions.
- Ex://
uprobe:libc:malloc
- Ex://
- dynamic hooks into user-space functions.
- kretprobes / uretprobes
- Return-based hooks (after a function has completed)
- Useful for examining return codes
While kprobes and uprobes are somewhat self-explanatory, tracepoints and, its more confusing counterpart, raw tracepoints are not. The beauty of linux however is that we can actually see these tracepoints within the actual linux kernel source code. Don’t get me wrong, I think Microsoft does a nice job with documentation, but nothing beats being able to actually see what’s happening. Let’s take a look!
To see the actual tracepoint API, we can read linux/include/linux/tracepoint.h. Here we see how both tracepoints are defined and initialized. If we want to see individual trace events being registered, we can pivot to the linux/include/trace/events/ directory to see header files (.h) defining and registering the events. These events are exactly what eBPF is calling in a tracepoint or raw tracepoint hook.
By far, the easiest way to get started learning how eBPF works is with bpftrace. Bpftrace is like a mini-BPF interpreter for your queries. You certainly won’t be writing a full-blown EDR with it, but it’s going to get your fingers on keys. While we could go digging through the kernel source code, bpftrace makes it easy for us to list the available hooks on a given system.
sudo bpftrace -lsudo bpftrace -l | grep syscalls:.*open
Writing bpftrace commands does require some knowledge of the bt language. Thankfully, this language, at a high level, is somewhat primitive, there isn’t too much to it. Below is a screenshot from the official bpftrace man page detailing the syntax of a fundamental bt action block. If you’re looking to write more advanced queries, I highly recommend you check out the official bpftrace man page for further documentation.
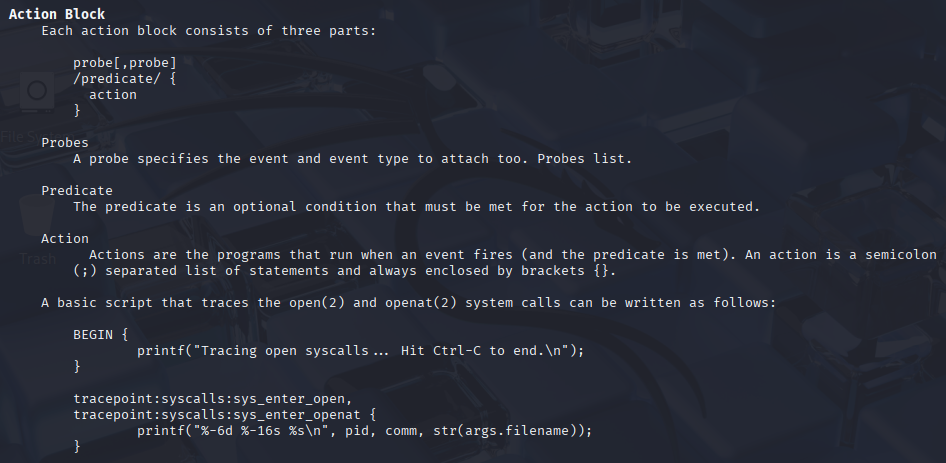
It’s important to also get familiar with the bpftrace builtins, A.K.A the reserved variables you see above (pid, comm, etc.). This documentation is available at the bottom of the official bpftrace man page. Commonly used builtins are referenced below:
arg0,arg1, …,argn– int64 – nth argument passed to the traceepid– uint32 – Process ID of the current threadcomm– string[16] – Name of the current threadretval– uint64 – Value returned by the tracee when tracing ret-based probesuid– uint64 – User ID of the current thread
Let’s start writing real bpftrace queries to mimic telemetry a DE would expect to gain from an EDR.
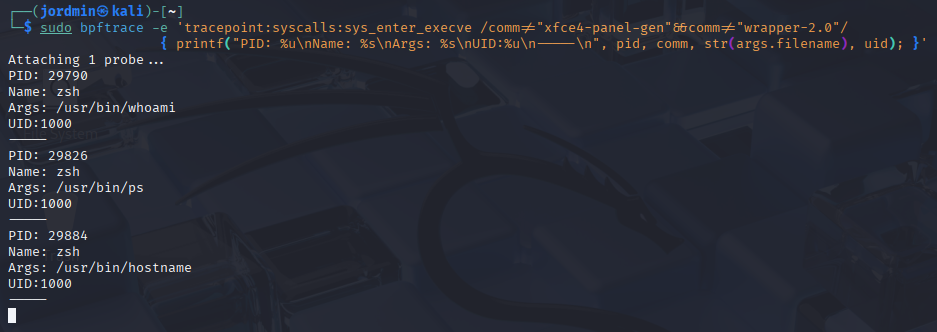
Example 1: Process Telemetry via execve syscall:
Example 2: Network Connection Telemetry via tcp_connect kprobe
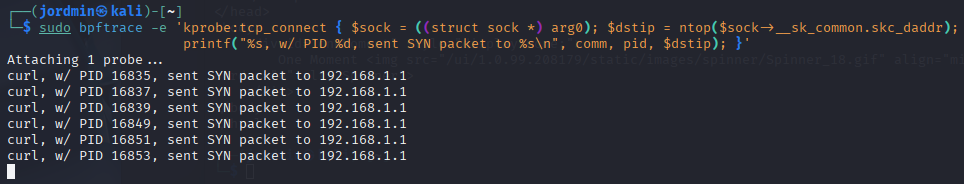
Notice the difference between tracepoint:syscalls and kprobe in the previous examples. Both of these hooks operate in kernel-land, you can see I’m referencing the kernel-land-exclusive sock struct in the second example. The difference between these two hooks is that tracepoints are statically defined hooks. These hooks are carefully maintained by Linux developers across versions to ensure compatibility. kprobe hooks can be inserted into any kernel function but are not nearly as stable and optimized.
As you can see, eBPF is a powerful method for gathering telemetry. While it’s far from being a standalone solution, it’s a fundamental piece to the EDR-stack puzzle.